Azure Maps is a great way to add geospatial capabilities to your apps, from showing a map on a web page, to checking geofences, to routing and traffic data. You can read more about Azure Maps in the official documentation.
This post covers:
- Showing an Azure Maps control on a web page
- Adding pins to the map to show locations
- Adding a path to the map
Getting started
- Start by signing up for Azure if you don’t have an account:If you are a student, sign up at azure.microsoft.com/free/students to get US$100 of free credit and free services for a year.Otherwise sign up at azure.microsoft.com/free to get US$200 of credit for 30 days and a year of free services.
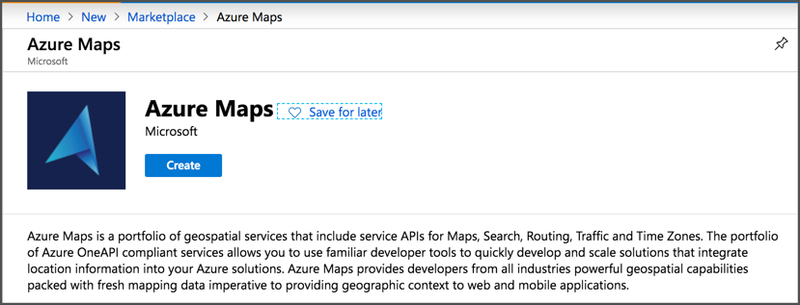
- Sign into Azure and create an Azure Maps resource by following this link.
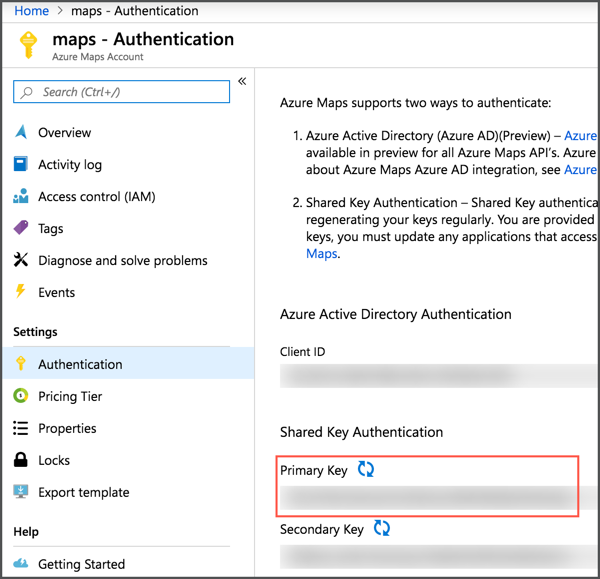
Once you have your Maps resource created, head to the Shared Key Authentication section of the _Settings -> Authentication _ tab in the map blade in the Azure portal and take a copy of your Primary Key.
Showing the Azure Maps control in a web page
Create a web site using your favorite tooling - I personally have been using Flask as I’m getting into Python. Create an HTML page. To the <head> section add the following to add support for the Azure Maps control:
<link rel="stylesheet" href="https://atlas.microsoft.com/sdk/javascript/mapcontrol/2/atlas.min.css" type="text/css">
<script src="https://atlas.microsoft.com/sdk/javascript/mapcontrol/2/atlas.min.js"></script>
In the <body>, add a div with an id of myMap.
<div id="myMap"></div>
Follow this with a script tag that creates the Azure Maps control and assigns it to this div:
<script type="text/javascript">
  var map = new atlas.Map('myMap', {
    language: 'en-US',
    authOptions: {
      authType: 'subscriptionKey',
      subscriptionKey: '{subscription-key}'
    }
  });
</script>
You will need to replace {subscription-key} with your primary key that you captured from from the Azure Maps resource blade.
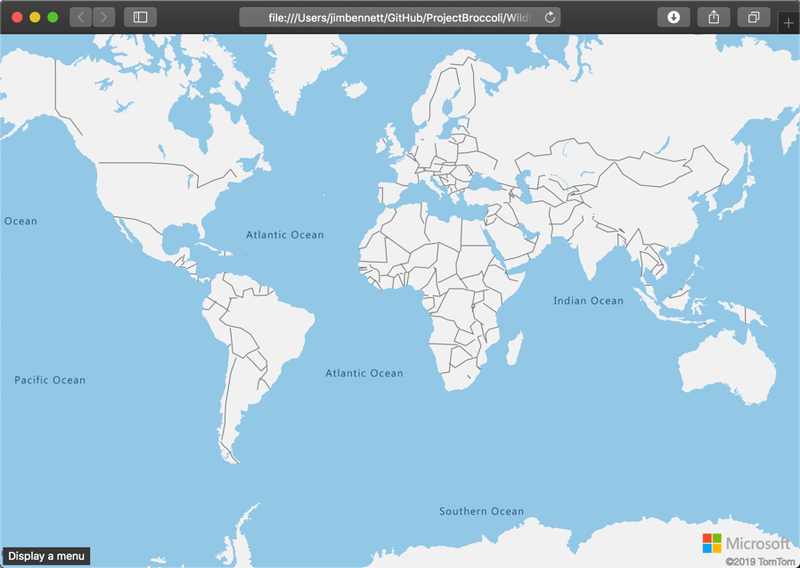
If you view this page you will see the map control over the top part of the page. To size it, you can style the map to be the size of the whole page by adding a style to the head:
<style>
  html, body {
    margin: 0;
  }

  #myMap {
    height: 100vh;
    width: 100vw;
  }
</style>
This will give a nice, full size map showing the whole world.
You can read more about getting started with the Map control in the Getting started docs.
Zooming into a certain area
You can set the area that the map shows by setting the camera using a set of bounds and some padding - essentially giving the coordinates that must be included in the visible map and how much space you want around them. The map control works out the actual position and zoom to ensure the bounds and padding are visible, with extra map showing to ensure it fits on the page.
First your page will need to wait till the map control is ready before it can call any methods. You can do this using the ready event:
map.events.add('ready', function () {
    // add code to be run when the map is ready here
}
Inside this handler, you can set the camera using the setCamera method:
map.setCamera({
  bounds: [{min_long}, {min_lat}, {max_long}, {max_lat}],
    padding: 50
});
Set min_long and min_lat to be one corner of the bounding box that you want to ensure is visible using longitude and latitude coordinates. max_long and max_lat are the opposite corner. Set padding to the minimum number of pixels to have around the edge of the bounds.
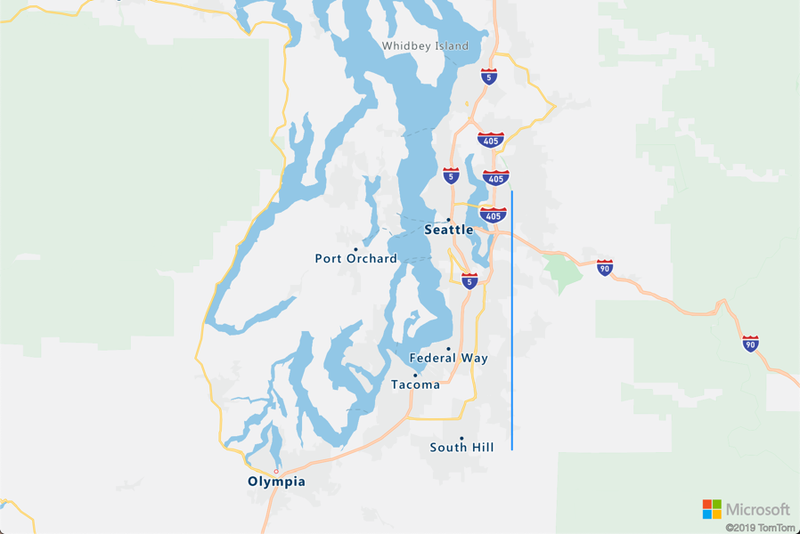
For example, this code shows the area around Seattle:
map.events.add('ready', function () {
  map.setCamera({
    bounds: [-123, 47, -122, 48],
    padding: 50
  });
}

You can read more about this method in the Map class docs.
Adding pins for a location
Maps can have added layers such as pins and paths, with each layer showing coordinate data. This data is put into a DataSource, which gets added to the map, then a layer is applied to this data source.
To show pins on a map, the coordinates for the pins are added as a map feature to the data source, and a SymbolLayer is added referencing this data source. The map will show a pin for each point in the data source.
First, create the data source in the maps ready event handler:
var dataSource = new atlas.source.DataSource();
map.sources.add(dataSource);
Then create a data feature to wrap a point and add it to the data source. Features can include single points, polygons or lines, in this case it is a single point.
dataSource.add(
  new atlas.data.Feature(
    new atlas.data.Point([{longitude}, {latitude}])));
In this code, {longitude} needs to be set to the longitude of the point, and {latitude} set to the latitude. Finally a symbol layer is added to show the pins, and this symbol layer wraps the data source:
map.layers.add(new atlas.layer.SymbolLayer(dataSource, null));

There’s loads more you can do with these symbol layers, including customizing the symbols using images. You can read more and try some of these out in the Azure Maps Symbol Layer docs.
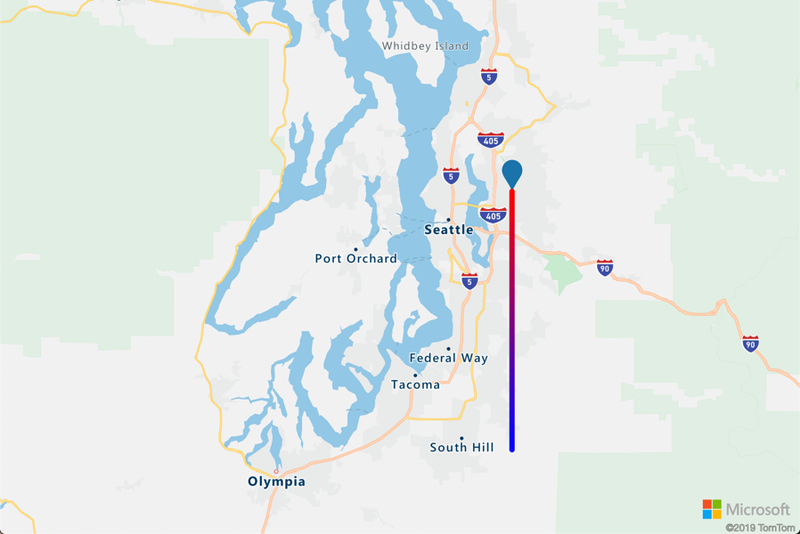
Showing a path on the map
As well as points, maps can also show a line layer. This is a series of points in a connected line, connected in the order the points are declared. This can be used to show a journey for example, tracking the route taken over time. You start with a data source, but this time with a flag set to show it contains line information:
var line_datasource = new atlas.source.DataSource(null, {
    lineMetrics: true
});
map.sources.add(line_datasource);
Next, a LineString feature is added to the data source:
line_datasource.add(new atlas.data.Feature(new atlas.data.LineString([
  [{point1_longitude}, {point1_latitude}],
  [{point2_longitude}, {point2_latitude}],
])));
Each point is added to the array passed into the LineString, in the order that you want the points to be connected. Finally a line layer is added to the map:
map.layers.add(new atlas.layer.LineLayer(line_datasource, null));
You can add multiple data sources to the map, and use them for multiple layers. For example you can have a data source for a line, and another for a point at the end of the line.

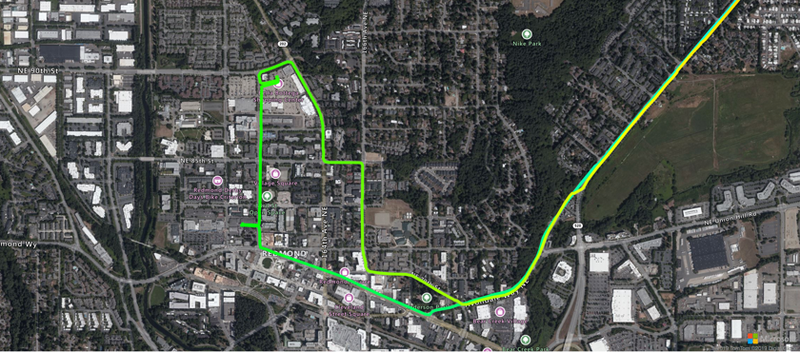
You can customize the line, such as the stroke size or color, including having color gradients to indicate the start and end of the line, by passing options when creating the layer. For example, to have a blue to red gradient, with red showing the end of the line (the last coordinate in the array passed to the data source), use the following:
map.layers.add(new atlas.layer.LineLayer(line_datasource, null, {
  strokeWidth: 6,
  strokeGradient: [
    'interpolate',
    ['linear'],
    ['line-progress'],
    0, "blue",
    1, "red"
  ]
}));
Summary
In this post we learned how to add an Azure Maps control to a web page, position the camera, add pins and add lines. Head to the official documentation to learn more about the capabilities of Azure Maps.