Dentists don’t want you to know these 5 tips that show how easy it is to run multiple Azure Functions apps locally and debug them all at the same time!
Number 3 will shock you!

Enough ClickBait nonsense, on to the post.
I recently built a demo app that has two Azure Functions projects in it - one using the new V2 Functions runtime and written in C#, and one using the old V1 runtime so that it can access some .NET framework bits and written in F#.
One of the really cool features that Azure Functions offers is the ability to run your functions locally with a full debugging experience, and this is supported in Visual Studio 2017 as well as VSCode.
This post focuses on how to do this in VS2017. For VSCode, follow these instructions.
This post looks at:
- Debugging one function app
- How to run multiple function apps at the same time
- How to debug multiple functions apps at the same time using Visual Studio 2017
Debugging one Function app
This is easy to try out yourself, just create a new Azure Functions app in Visual Studio, add a breakpoint in the HTTP trigger then start debugging. The Azure Function app will launch in a local functions host, and your trigger will be available locally on http://localhost:7071/api/Function1 - so listening on port 7071. You can launch your favorite browser, navigate to this URL and your breakpoint will be hit, giving a full debugging experience with watch, edit and continue and all the normal bells and whistles.
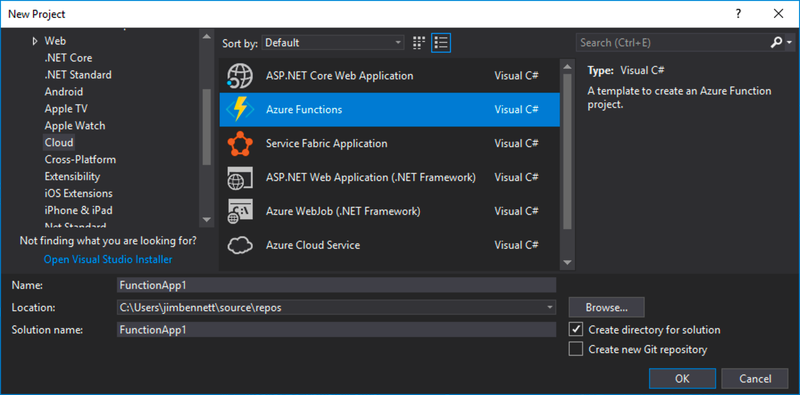
Create one of these:
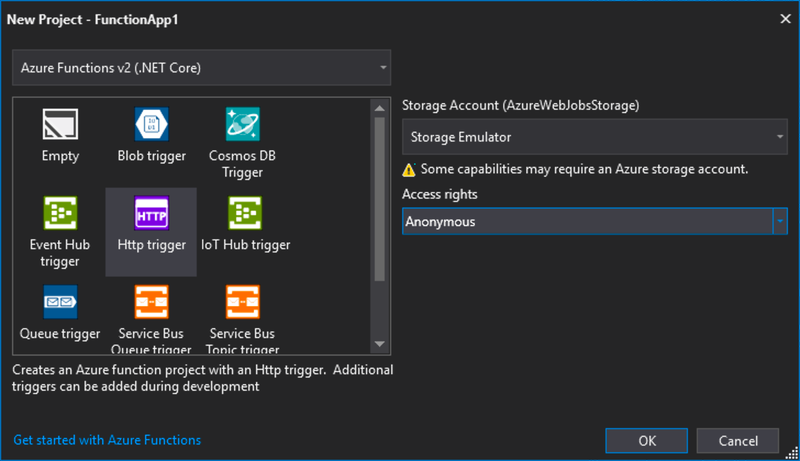
Use these settings (V2, HTTP Trigger, Anonymous):
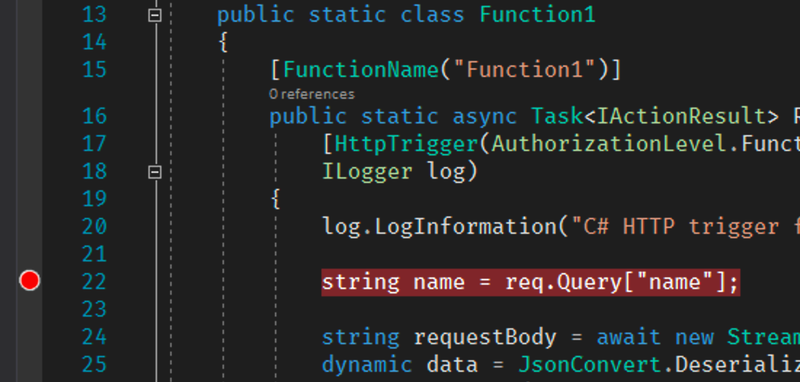
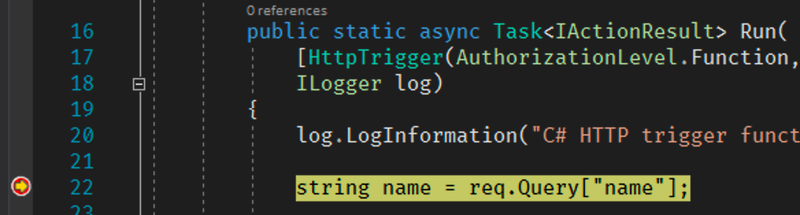
Stick a break point in the function:
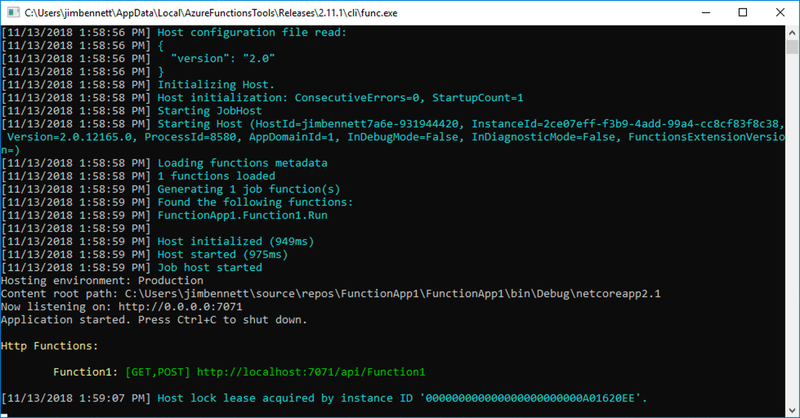
Start debugging the function the same way as any normal app (you may need to grant firewall access). This will launch a console window with the functions host running - you’ll see some cool ASCII art then the functions output including the HTTP URLs for all HTTP triggers:
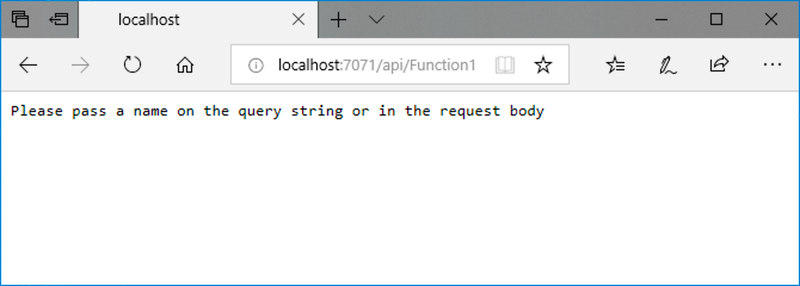
Now launch your favorite browser and navigate to the Function1 URL. The function will run and your breakpoint will be hit. This is a full debug session with edit and continue:
Click Continue and see the output of the function in your browser:
There is also a storage emulator that you can run locally so you can read/write to blobs, tables and queues and even use triggers. Read more here.
Running multiple Function apps at the same time
Running one function app locally is cool, running multiple is even cooler!

Add a new function app to your project, then run it without debugging using Debug->Start without debugging. This will spin up the local Azure Functions host and start listening on port 7071.
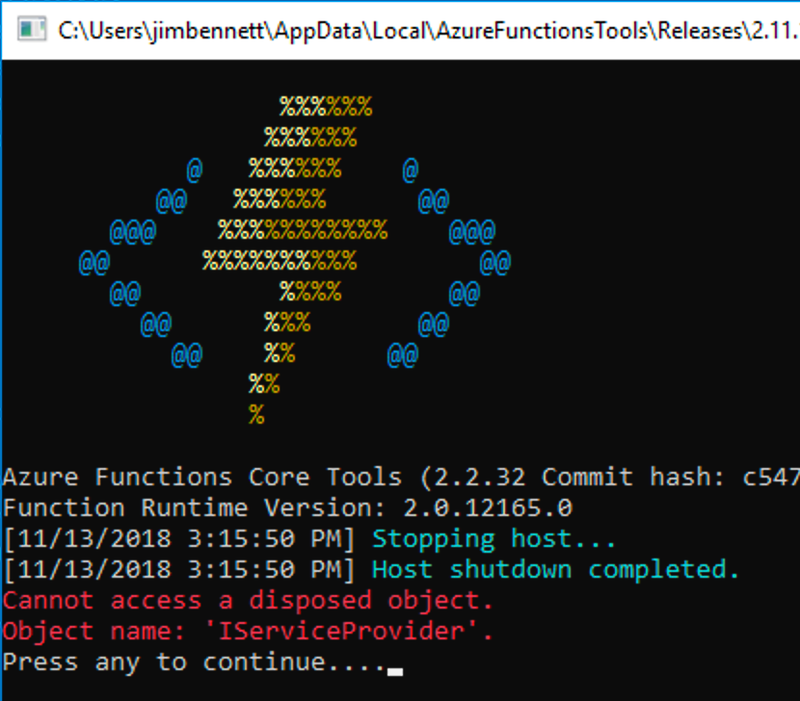
Now the beady-eyed amongst you will notice this is the same port as the first functions app. By default the local functions host listens for HTTP requests on port 7071, so if you now launch the first functions app it will fail - with a really weird error:
Cannot access a disposed object.
Object name: 'IServiceProvider'.
The fix for this is to tell the functions host to run on a different port, and this can be done by adding arguments to the command line that is run when the function app is debugged. Kill all the functions hosts, and open the properties for the second function app. Head to the Debug tab, and set the Application arguments to be:
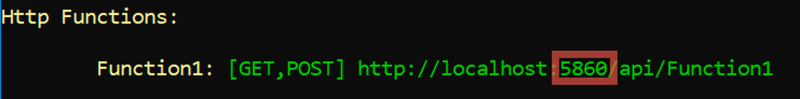
host start --pause-on-error --port 5860
This will start the functions host listening on port 5860. You can use any port you wish for this of course.
These settings are not saved in the project itself, just in your user settings so this won’t be in source control.
Now if you run the second function app it will be listening on a different port:
Debugging multiple function apps in VS2017
Running multiple is good, but debugging them is even gooderer!
![]()
Although Visual Studio 2017 can’t launch multiple apps at the same time, you can launch one then attach to the others. To do this:
- Put break points in the HTTP triggers for both function apps
- Start the first function app without debugging
- Start the second function app through the debugger
- Attach the debugger to the first function app:
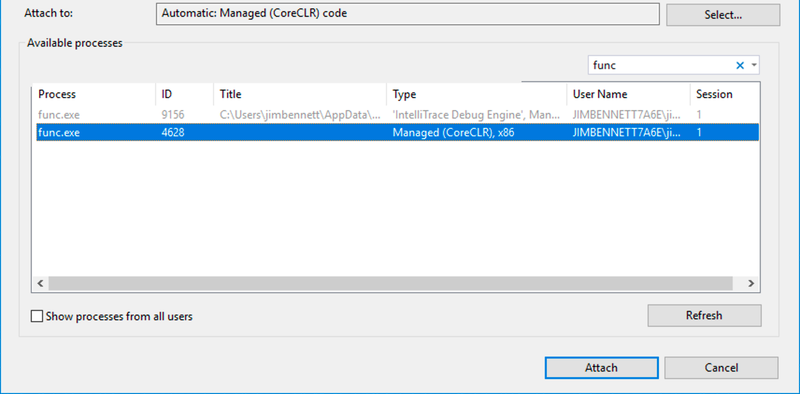
- Select Debug->Attach to process…
- Search for func
- One
func.exeprocess will be greyed out - this is the one that is currently running through the debugger. Select the other one and click Attach.
You should now be able to open http://localhost:7071/api/Function1 in your browser and hit the breakpoint in your first function app, and open http://localhost:5860/api/Function1 to hit the breakpoint in the second function app.
You don’t get edit and continue in the function app you attached to, only in the one run through the original debugger. If you want edit and continue make sure the function app you want to use this for is run through the debugger, and attach to the others.
Want to learn more about Azure Functions? Well we have a learning path for that as part of Microsoft Learn. Check it out here.
